Core PCE inflation was 3.1% in September 2026
The reading is up 0.1 percentage points from August 2026, when annual core PCE inflation was 3.0%.
Core PCE inflation, September 2026. Published .
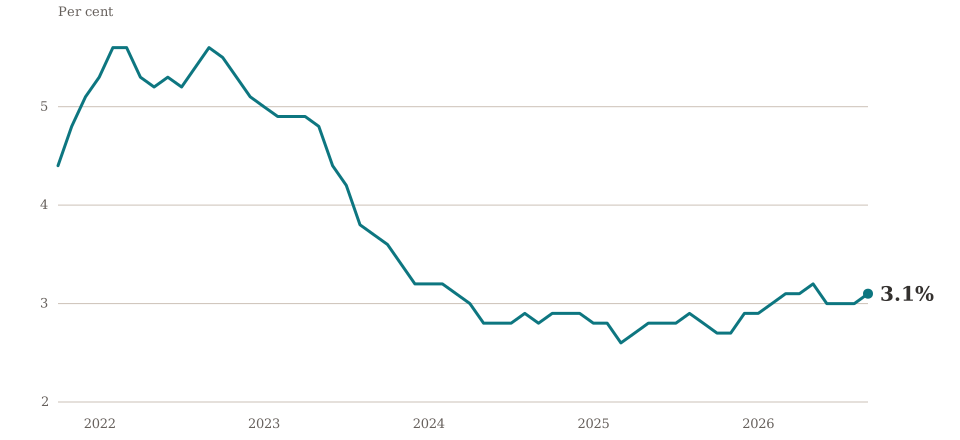
Annual core PCE inflation, which excludes food and energy prices, was 3.1% in September 2026.1
The previous reading, for August 2026, was 3.0%.2 The latest figure is up 0.1 percentage points from that reading.3 A year earlier, in September 2025, the reading was 2.8%.4
Over the latest 12 readings, the range was 2.7% to 3.2%.5
The numbers behind this article
Each figure was calculated in code from the official series. The small numbers in the text point to these lines.
- Annual core PCE inflation, which excludes food and energy prices, was 3.1% in September 2026.
- The previous reading, for August 2026, was 3.0%.
- The latest figure is up 0.1 percentage points from the previous reading.
- A year earlier, in September 2025, the reading was 2.8%.
- Over the latest 12 readings, the range was 2.7% to 3.2%.
Sources
Drafted with AI (claude-sonnet-5-5) from the figures above and checked by automated tests and a human editor. Spotted a mistake? Tell us or read the corrections policy.